Context: The case of the DB Time > CPU Time + Wait Time
Oracle instrumentation provides wait event and CPU time accounting, a powerful and readily accessible data source for performance troubleshooting. An Oracle session at a given point in time is either on CPU, for example when processing data from cache, or it is in a waiting state, for example waiting for an I/O operation to complete.
A recent talk by John Beresniewicz (JB) at the Oak Table World 2015 goes into the details of an interesting case, where the CPU time and wait time measurements from Oracle's V$ tables (and AWR reports) appear to violate the equation "CPU time + Wait time = DB Time".
In particular JB discusses in details a case of I/O testing, originally raised by Kevin Closson, where this discrepancy is apparent and originates from the fact of using modern "fast" storage.
To further set the context for the following discussion, you can watch JB's presentation and the slides. In short the root cause of the issue is that a significant amount of CPU cycles spent serving I/Os by the OS can be double counted both into Oracle I/O wait events and CPU counters. In this post you will learn of a technique and related tools for extended stack tracing that can be used to investigate this and similar cases and provide direct evidence of what is happening "inside Oracle wait events".
A test system reproducing high CPU usage inside I/O wait events
This is about reproducing a case where AWR reports %Wait + %CPU > 100% (of DB Time). Following the original case reported by JB, the test cases are generated using Kevin Closson's SLOB. One crucial point for the following is to have a system that serves random I/O with low latency. For this you don't necessarily need expensive HW, you can emulate (for testing) a fast I/O subsystem in various ways, typically using RAM-based devices.
The test system used in the following is a Virtual box VM with 4 CPU/cores and 4GB of RAM. The test DB is installed with OL 6.7 and the test database is Oracle version 12.1.0.2. Storage has been configured as three block devices and handled with ASM on the database in the VM, but it is actually served by 3 files on the host machine. The buffer cache of the test database is set to a very low size, 64MB.
The important point is that the host where Virtualbox runs has enough RAM to be able to cache the files used as storage for the test DB. A host with 128 GB of RAM has been used and the active set for the test DB is 40 GB.
Running the test workload, I/O bound with low latency I/O and high number of IOPS
This first test consists in running SLOB for a few minutes to drive the (I/O bound) workload. It is a simple read-only workload (random reads of single Oracle blocks, 8 KB) and no updates. Only one SLOB schema is needed, this has also the advantage of keeping the overall server CPU utilization low. Some relevant slob.conf parameters are: SCALE=40000M, UPDATE_PCT=0, RUN_TIME=1000. The command to run the test, after SLOB schema setup, is simply ./runit.sh 1.
Additional checks and boundary conditions are:
- The system is not CPU-bound. This should be the case if the only workload on the database is the one-schema SLOB run. However it is important to double check with OS commands, for example "vmstat" or "top". In a CPU-bound server interpreting CPU and wait time becomes more complicated, due to the additional time spent waiting in the run queue.
- I/Os are served at low latency and high IOPS. If you build your test machine using a VM created with Virtualbox, as described earlier in this post, this can be achieved by using a host with enough RAM to cache the files acting as back-end for the VM storage. The caching on the host filesystem would normally happen during SLOB schema creation, if the host server has enough RAM and no concurrent activity is competing for the filesystem cache. However if needed, caching can be triggered by running a few full scans of the USER1.CF1 table.
The test reproduces the case "%Wait + %CPU > 100%"
The AWR report of the SLOB workload shows that main activity on the database is random reads, instrumented by Oracle with the wait events: "db file parallel read", "db file sequential read" and by CPU time. The AWR report also shows that the system did not have any other significant activity besides the SLOB workload. The notable point (see also Figure 1) is that the sum of the percentage of DB time spent on non-idle wait events and CPU adds up to a value significantly higher than 100%. This is an anomaly, as it seems to violate the concept that an Oracle process at a given point in time is either on CPU or waiting for a wait event.

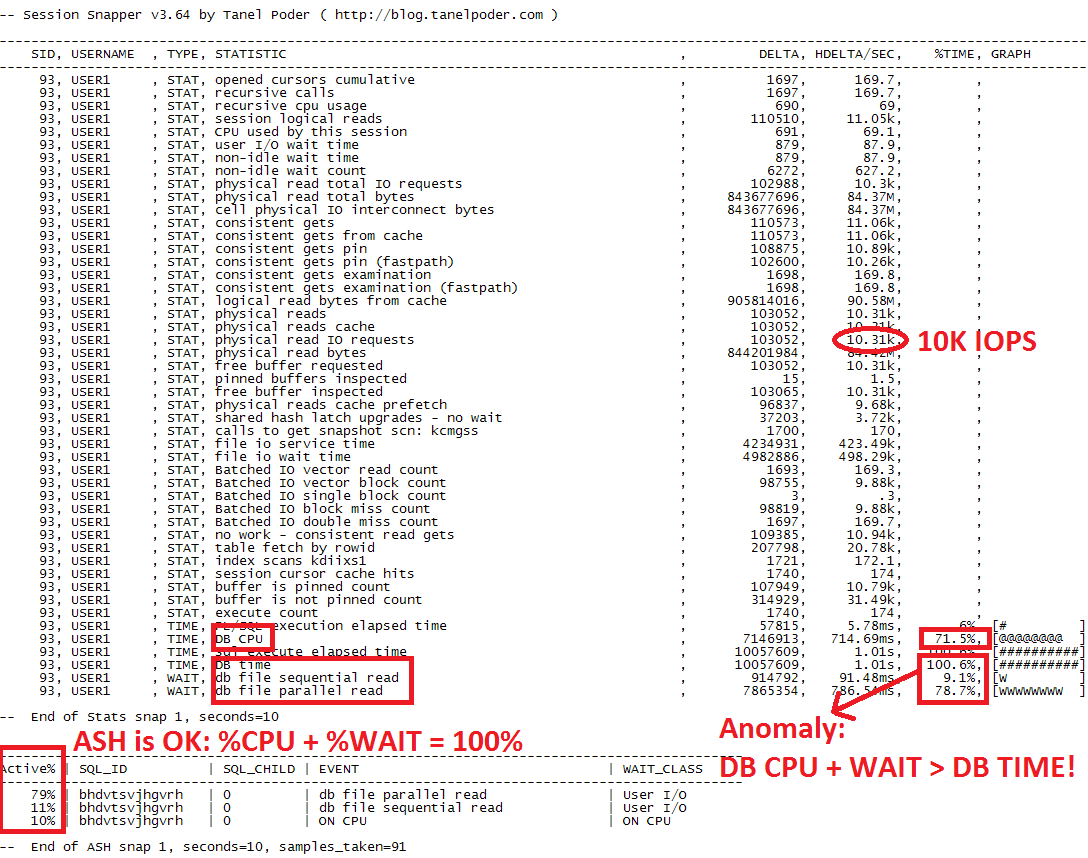
Another way to measure the workload is with Tanel Poder's snapper. Snapper has the advantage of drilling down to session level rather than aggregating at the system level. The output of a 10-second sample is reported in Figure 2. From the metrics reported there, you can see that the workload is mostly single-block reads at a rate of 10K IOPS and that the wait time for I/O wait and CPU adds up to a value larger than DB Time. Note that DB Time for this workload is equal to the elapsed time, as there is only 1 session active and it is active all the time serving DB calls. An extract of relevant snapper measurements from Figure 2 is:
TIME, DB CPU: 71.5%
WAIT, db file sequential read: 9.1%
WAIT, db file parallel read: 78.7%
STAT, physical read IO requests: 10.31k
Something is wrong: the sum of CPU time and wait time should not be larger than DB time. One first check that you can do is to investigate if the CPU time measurement reported by Oracle is accurate. It turns out that the problem is not here, you can verify this using OS commands, for example with "pidstat". Pidstat output (not reported here for brevity) is also interesting because it adds two additional pieces of information: it confirms that the process spends most of its time on CPU and that the CPU cycles are accounted as "sys" CPU time, i.e. time spent in kernel operations.
The wait events are timed by Oracle, at the beginning of the wait and measured again at the end. The Oracle functions kskthbwt (Kernel service Kompile thread begin wait) and kskthewt (Kernel service Kompile thread end wait) appear to take care of measuring the wait time and update the instrumentation with the relevant metrics. In particular the wait time measurement for "db file sequential read" and "db file parallel read" seems to correctly account for the time spent in OS calls from the tracing tests performed by the author and reported in the post "Life of an Oracle I/O: Tracing Logical and Physical I/O with SystemTap".
Moving into the active session sampling data of snapper reported at the bottom of Figure 2, you can find a more correct picture of where DB Time is spent: most of the DB time is spent in wait and a small amount on CPU. Most importantly the sum of DB CPU and Wait events adds up to 100%, as expected.
Following JB's analysis, the collected evidence points to the fact that many CPU cycles spent performing kernel-related activities for serving I/O are accounted into Oracle wait events. Therefore the sum of %CPU and %Wait is higher than 100% because of the double counting that happens in these events, especially with the I/O interface is working at a high rate of IOPS. In the following you will see how profiling of OS-process state together with wait events and kernel stacks provides direct observation of this hypothesis.
Direct investigation with extended stack traces and flame graphs
The idea is to sample the Oracle process running the test workload (random I/O driven by SLOB) using kernel stack profiles extended with additional sampling of the Oracle OS-process state and the Oracle wait event interface. This is an extension of the work discussed in the blog article "Linux Kernel Stack Profiling and Flame Graphs Applied to Oracle Investigations". A custom tool ORA_KStackProfiler is introduced to perform the following actions:
- sampling of /proc/<pid>/stat to measure the process state (Running, Stopped, Disk, etc),
- sampling /proc/<pid>/stack to sample the kernel stack trace if any
- sampling the status of the Oracle session (on CPU of waiting for a wait event). The sampling is done directly from SGA by reading the memory locations corresponding to X$KSUSE.KSUSEOPC and X$KSUSE.KSUSETIM.
1. Run "make" to build the executable: ora_kstackprofiler
2. Run the scripts in the oracle_scripts directory
- run eventsname.sql using SQL*plus to generate the file eventsname.sed translating event# into event names
- run find_pid_ksustim_ksuseopc.sql using SQL*plus to find the pid and details of X$KSUSE of the Oracle session to trace
Example:
SQL> @find_pid_ksustim_ksuseopc.sql
This script finds the OS pid and address of X$KSUSE.KSUSEOPC and X$KSUSE.KSUSETIM for a given Oracle session. To be used together with ora_kstackprofiler. Run as user SYS.
Enter Oracle SID to be investigated: 111
OS pid = 1234, ksuseopc = 5796061762, ksusetim = 5796061792
3. Stack traces sampling extended with Oracle wait event data as in the following example:
./ora_kstackprofiler --pid 1234 --delay 100 --count 1000 --ksuseopc 5796061762 --ksusetim 5796061792 > ora_stack_slob_fastio.txt
4. Process the output with additional filtering and with flame graphs for visualization using https://github.com/brendangregg/FlameGraph
cat ora_stack_slob_fastio.txt| grep -v 0xffffffffffffffff | sed -f oracle_scripts/eventsname.sed | ../FlameGraph/stackcollapse-stap.pl| ../FlameGraph/flamegraph.pl --title "Kernel stack, OS State and Wait event profiling of Oracle random I/O (SLOB workload, low latency I/O)" > ora_stack_slob_fastio.svg

Figure 3: Flame graph visualization of Kernel stack traces extended with process state sampling and wait event details from SGA show a large amount of CPU cycles consumed inside the wait events "db file parallel read" and "db file sequential read" for an I/O bound workload (low-latency random reads generated with SLOB). Note that the wait event details from SGA is reported at the bottom of the graph. The line above that is the process state from /proc/<pid>/stat. On top, the kernel stack trace from /proc/<pid>/stack. Click here for a svg version of the graph.
Figure 3 shows a flame graph of the Kernel stack traces extended with process state sampling and wait event details from SGA. The wait event data is sampled from SGA (and in particular from the memory locations for X$KSUSE.KSUSEOPC and X$KSUSE.KSUSETIM) and displayed at the bottom line of the graph. Just on top of that, the OS process state from /proc/<pid>/stat, finally the kernel stack data from /proc/<pid>/stack.
The flame graph of Figure 3 provides direct evidence of the fact that a significant amount of the time accounted by Oracle as wait events for I/O, is actually spent consuming CPU cycles for serving I/O.
This is consistent with the fact that I/O in this test is served at high rate. The percentage of samples marked as "On CPU (Oracle state)" is about 10%, which is consistent with what measured with ASH (see snapper output in Figure 2).
There are some important limitations in the method of extended stack sampling: sampling of the stack profile, process state and Oracle wait event details is not atomic, so we can expect mismatches. Moreover in Figure 3 you can see that the percentage of samples in OS state "running" is higher that the amount of CPU time measured with pidstat, in this example by about 20%. Note that the state "running" reported from /proc/pid/status, means that the process is either actually running on CPU or that it is runnable state (in the run queue). When reading the flame graph you should also remember that it is based on sampling, therefore it shows the stack traces that are mostly active. For example in Figure 3 you can see io_submit as one of the most active functions/code paths for asynchronous I/O (in the context of the wait event "db file parallel read"). The corresponding call io_getevents does not appear in the graph as the low latency and high rate of I/O makes this operation very fast. Tracing with strace or SystemTap can be used to further drill down on this observation with measurements of the I/O calls and their timing.
For additional understanding of what the system is doing it is useful to measure also the userspace stack. For this an extended tool is introduced: Ptrace_Profiler.
The output of Ptrace_Profiler is reported in Figure 4, with some annotations of relevant functions in the userspace and their meaning. You can see that most of the time is spent in operations related to asynchronous I/O, both on the kernel level and on the userspace libaio function. This is consistent with the workload executing random reads under the wait event "db file parallel read" at high speed.

I/O latency
The nature of the workload and in particular the high number of IOPS and low latency of the storage play an important role in amplifying the amount of CPU consumed in Oracle wait events per unit of time (more work requires more CPU cycles). A direct confirmation that the storage is serving I/O at low latency can be found with OS-based tools reading from block I/O tracepoints. The following tools can be used based on SystemTap and Ftrace: blockio_rq_issue_filter_latencyhistogram.stp and iolatency_micro. Some sample measurements are reported here below. Note that a large number of I/O requests are served in the bucket 64-to-128 microseconds.
# ./iolatency_micro 10
Tracing block I/O. Output every DeltaT = 10 seconds. Ctrl-C to end.
>=(mus) .. <(mus) : IOPS IO_latency/DeltaT |IOPS Distribution |
16 -> 32 : 0 0 | |
32 -> 64 : 623 29947 |#### |
64 -> 128 : 6302 605049 |######################################|
128 -> 256 : 3482 668659 |##################### |
256 -> 512 : 664 255206 |##### |
512 -> 1024 : 47 36249 |# |
1024 -> 2048 : 3 5529 |# |
2048 -> 4096 : 4 13209 |# |
No double counting of CPU usage into wait events with slow I/O
You may not have found a situation like the one described above in your production DBs. Here we want to investigate what made the test "special". The key element of the example above is the low latency and high IOPS of the test workload. This causes the system to be very busy serving I/O and this amplifies the effect of double counting CPU in wait events. In this paragraph an additional test will hopefully make the matter more clear. The idea is to run the same SLOB workload against a storage system serving I/Os with much higher latency. In the test system used for this blog post, based on a VM, the I/O can be slowed down simply by flushing the filesystem cache on the host system (that is the system running Virtualbox):
# free && sync && echo 3 > /proc/sys/vm/drop_caches && free
The next step is to start the SLOB workload using the same test parameters as in the previous test, with the main difference that the I/O workload now runs against a much slower storage system: I/Os are not cached in the Virtualbox host anymore and are served by slow SATA disks. Using OS instrumentation and the AWR report one can quickly see that the system is I/O bound, serving only 300 IOPS (it was 10K IOPS in the previous test with low-latency I/O). Note also from Figure 5 that in this test %DB CPU + %Wait = 102% (of DB Time). This number is quite close to the ideal value of 100% and could easily be interpreted as measurement noise, if you did not have the above analysis to explain the effect double counting of CPU in I/O wait events. Here below an example of the latency histogram taken during this test, note the predominance of very high I/O latency.
# ./iolatency_micro 10
Tracing block I/O. Output every DeltaT = 10 seconds. Ctrl-C to end.
>=(mus) .. <(mus) : IOPS IO_latency/DeltaT |IOPS Distribution |
64 -> 128 : 0 48 |# |
128 -> 256 : 2 480 |# |
256 -> 512 : 5 2150 |## |
512 -> 1024 : 3 2918 |## |
1024 -> 2048 : 3 5222 |# |
2048 -> 4096 : 1 3686 |# |
4096 -> 8192 : 13 80486 |#### |
8192 -> 16384 : 27 333004 |######## |
16384 -> 32768 : 44 1103462 |############# |
32768 -> 65536 : 75 3706060 |###################### |
65536 -> 131072 : 136 13389004 |######################################|
131072 -> 262144 : 38 7569408 |########### |
262144 -> 524288 : 0 157286 |# |

Figure 5: Extract of the AWR report showing the top wait time for a test using SLOB workload against "slow I/O". Note that DB CPU and no-idle Wait sums up to 102% of DB Time. Which is close to the ideal case of a sum of 100%.
Using ORA_KStackProfiler you can get a more detailed view of what the system is doing while running the SLOB workload: most of the time is spent inside an I/O wait event, the most important being "db file parallel read". However contrary to the case of Figure 3, here the process is mostly in Sleep or Disk Sleep state, waiting for the io_getevents call reap I/Os. The flame graphs of Figure 6 (slow I/O) and Figure 3 (fast I/O) appear to be quite different but they just reflect two aspects of asynchronous I/O underlying the "db file parallel read" wait event. In the case of low latency I/O (Figure 3) most of the I/O wait time is spent submitting I/O while getting the results is very fast, in the opposite example of slow I/O (Figure 6), most of the execution time is spent waiting to reap I/Os (io_getevents). The code path is the same, stack profiling and flame graphs highlight in each case the code path where most of the time is spent.
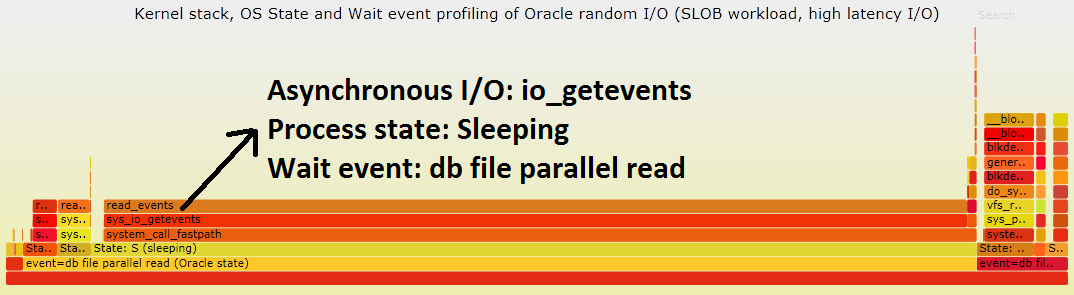
Figure 6: Flame graph of the kernel stack profile extended with OS process state and wait event details for an I/O-bound Oracle workload generated with SLOB. The I/O system is serving I/Os at about 300 IOPS. Most of the time is spent waiting for I/O. During the I/O wait time the Oracle process is mostly in Sleep or Disk sleep state, although also on running/runnable state for a fraction of the time. Click here for a svg version of the graph.
Conclusions
Extended stack profiling and flame graphs combine visualization of kernel stack trace profiles, userspace stack, OS process state and Oracle wait event data. This technique can be used for advanced troubleshooting and root cause analysis to find the code paths that are most frequently executed and correlate this information with the application context. For Oracle troubleshooting this leads to additional data beyond what is available with the wait interface, to be used in special cases where low-level investigations are needed. An example is provided of using extended stack profiling for drilling down on a case of high utilization of CPU inside I/O wait events where the one observes the anomaly DB CPU Time + Wait Time >> DB time. Extended stack profiles and flame graphs provide direct evidence of what happens in the system and why CPU is consumed inside Oracle wait events.
Download the tools and previous work
The tool discussed in this post can be downloaded from this webpage or from Github.
Relevant previous work on stack profiling, flame graphs and investigations of Oracle workload and wait events can be found at: "Oracle Optimizer Investigated with Flame Graphs", "Flame Graphs for Oracle", "Linux Kernel Stack Profiling and Flame Graphs Applied to Oracle Investigations", "Life of an Oracle I/O: Tracing Logical and Physical I/O with SystemTap".
Brendan Gregg is the inventor of flame graphs and has published very interesting material on the topic. John Beresniewicz (JB)'s talk at the Oak Table World 2015 has discussed the original test case for this blog post. Kevin Closson is the author of SLOB. Tanel Poder has covered the topic of profiling /proc/<pid>/stack in his blog. Frits Hoogland has many details on Oracle internals and I/O investigations in his blog.